
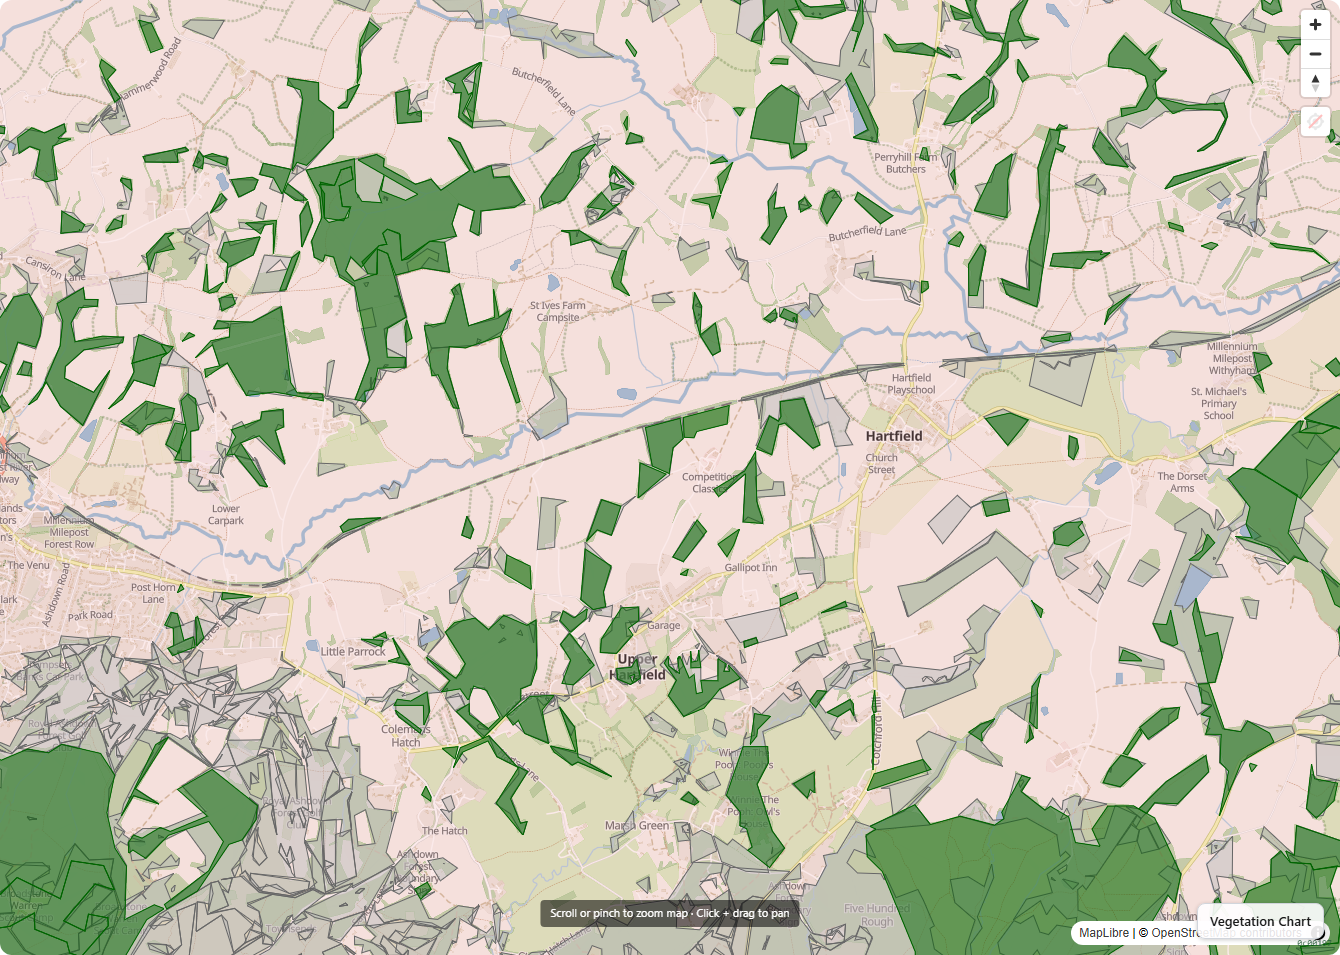
What it does
- Multi-scale views: parcel, holding, sub-catchment, catchment, partnership, bioregion
- Hillshade and slope derived from Environment Agency LiDAR
- Canopy height mapping showing where trees actually are now
- Editable boundaries; polygon upload from GeoJSON and shapefile
- Parcel ingestion from SBI + RPA WFS for SBI-registered farms, with map-based confirmation
- Layered annotations — pin photos, notes, fieldwork, historic features anywhere
- Aerial photography discovery: see where the Environment Agency has captured 10–50 cm imagery for your land and which years, with one-click download routing to the Defra portal
- Historic aerial photography deep-links to four UK archives (Historic England, Britain from Above, NCAP, Cambridge) for landscape-change context back to 1919
- Field observations you've digitised in QGIS upload back into the platform as a styleable layer alongside our computed overlays
- Export your farm's complete layer stack as a QGIS project + GeoPackage zip — render our analysis alongside any imagery you bring
Why it matters
Ecological consultancies, conservation organisations, and catchment coordinators work across multiple holdings, multiple clients, and multiple scales simultaneously. Ecology App keeps every scale live at once: zoom out for the strategic story, zoom in for the field decision, with detail preserved at every level.
Example
A bioregion coordinator running an 80-landowner network across a single catchment in south-east England uses Ecology App to maintain a live recruitment-curve map: which parcels are in, which are being approached, which are dark. The same map is the spatial annex to every funder bid the network sends out.